After the last PQ boxes were removed in December 2020 (see Post Measurement Campaign) the processing of the measurement data was finished during the last weeks. Each PQ box recorded measured values of current and voltage every second at its respective measuring point in the NETZlabor Freiamt for several weeks. In addition, regular oscilloscope images with significantly higher temporal resolution were recorded. Although the measuring boxes were connected to and synchronised via a radio clock during the measurement, there were recording gaps with individual measuring devices. This must be taken into account during data processing.
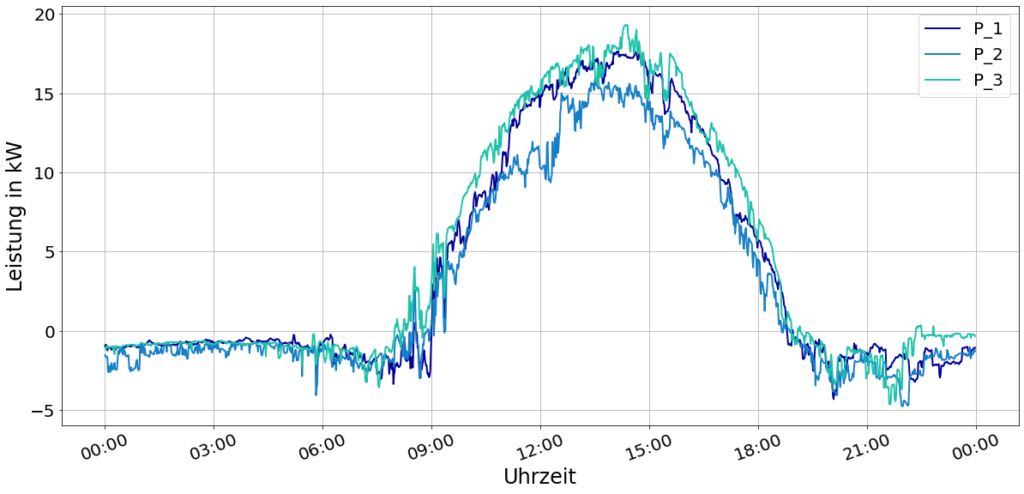
The two graphs below show the course of voltage and power on all three phases of the grid at one point for one day as an example. The measurement data was recorded on a sunny day in a grid node at the low-voltage level, a so-called cable distribution cabinet. When looking at the power, it can be seen that the values before 9 am and after 7 pm are negative on all three phases. This means that power is flowing from the grid to the households. From 9 am to 7 pm, while the sun is shining, the power is positive. The power generated by the installed PV systems is therefore greater than the consumption in the households during this period and the surplus power is delivered to the grid.
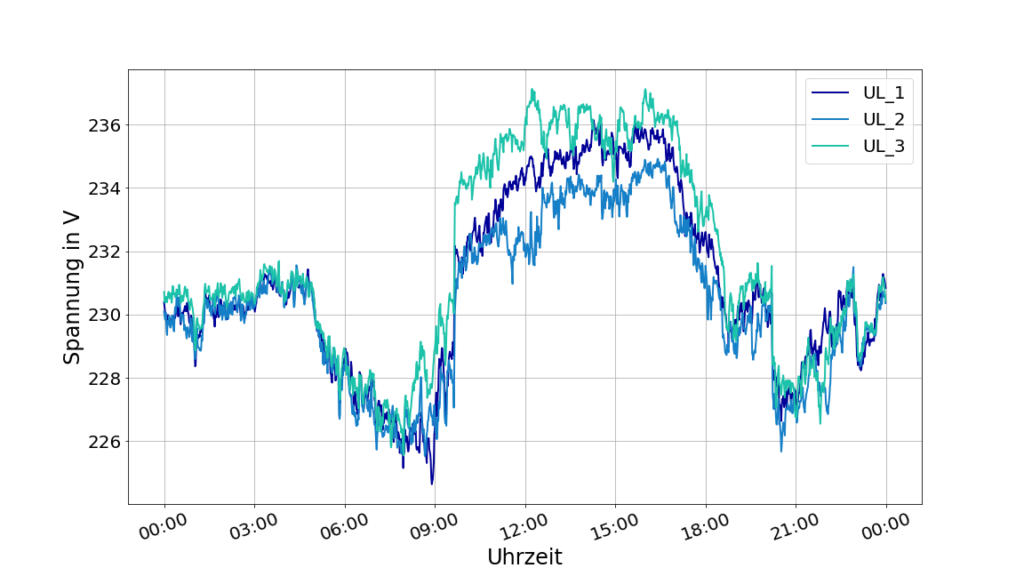
This behaviour is also reflected in the voltage curves. In times of high PV production, the grid voltage in the cable distribution cabinet is clearly visible above the nominal voltage of 230 volts, while at night it tends to be at and slightly below 230 volts. The challenges for the energy transition in the distribution grid can be clearly seen from these real measured curves.
The project will use the data and insights gained from this first field test to implement the flexQgrid concept for flexible control in a more robust and coordinated way.